Chaiyong Ragkhitwetsagul, Jens Krinke, David Clark
CREST centre, Department of Computer Science, University College London
Additional material to:
Chaiyong Ragkhitwetsagul, Jens Krinke, David Clark: A Comparison of Code Similarity Analysers. Empirical Software Engineering, 23, 2464–2519 (2018). DOI: 10.1007/s10664-017-9564-7
As an extension to:
Chaiyong Ragkhitwetsagul, Jens Krinke, David Clark: Similarity of Source Code in the Presence of Pervasive Modifications. 16th International Working Conference on Source Code Analysis and Manipulation (SCAM), Raleigh, NC, USA, October 2016.
Download the OCD Framework
Abstract
Source code analysis to detect code cloning, code plagiarism, and code reuse suffers from the problem of code modifications. We are interested in two types of code modifications in this study: pervasive modifications, i.e. transformations that may have a global effect, and local modifications, i.e. code changes that are contained in a single method or code block. We evaluate 30 similarity detection techniques and tools using five experimental scenarios for Java source code. These are (1) pervasively modified code, created with tools for source code and bytecode obfuscation, and boiler-plate code, (2) source code normalisation through compilation and decompilation using different decompilers, (3) reuse of optimal configurations over different data sets, (4) tool evaluation using ranked-based measures, and (5) local+global code modifications. Our experimental results show that with the presence of pervasive modifications, some of the general textual similarity measures can offer similar performance to specialised code similarity tools, while in the presence of boiler-plate code, highly specialised source code similarity detection techniques and tools outperform textual similarity measures. Our study strongly validates the use of compilation/decompilation as a normalisation technique. Its use reduced false classifications to zero for three of the tools. Moreover, we demonstrate that optimal configurations are very sensitive to a specific data set. After directly applying optimal configurations derived from one data set to another, the tools perform poorly on the new data set. Code similarity analysers are thoroughly evaluated not only based on several well-known pair-based and query-based error measures but also on each specific type of pervasive code modification. This broad, thorough study is the largest in existence and potentially an invaluable guide for future users of similarity detection in source code.
Contents
- The Experimental Framework
- Tools and Techniques
- Scenario 1: Pervasive Modifications (data set)
- Scenario 2: Decompilation (data set)
- Scenario 3: Reused Boiler-Plate Code (data set)
- Scenario 4: Ranked Results
- Scenario 5: Local + Global Modifications (data set)
- Results
- Research Question 1 (Performance comparison)
- Research Question 2 (Optimal Configurations)
- Research Question 3 (Normalisation by Decompilation)
- Research Question 4 (Reuse of Configurations)
- Research Question 5 (Ranked Results)
- Research Question 6 (Local + Global Code Modifications)
The Experimental Framework
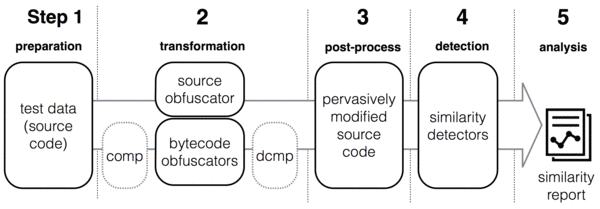
The general framework of our study as shown below consists of 5 main steps. In Step 1, we collect test data consisting of Java source code files. Next, the source files are transformed by applying pervasive modifications at source and bytecode level. In the third step, all original and transformed source files are normalised. A simple form of normalisation is pretty printing the source files which is used in similarity or clone detection. We also use decompilation. In Step 4, the similarity detection tools are executed pairwise against the set of all normalised files, producing similarity reports for every pair. In the last step, the similarity reports are analysed.
Tools and Techniques
Several tools and techniques were used in this study. These fall into three categories: obfuscators, decompilers, and detectors. The tool set included source and bytecode obfuscators, and two decompilers. The detectors cover a wide range of similarity measurement techniques and methods including plagiarism and clone detection, compression distance, string matching, and information retrieval. All tools are open source in order to expedite the repeatability of our experiments.
Obfuscators, Decompilers
| Type | Tool | Link |
|---|---|---|
| Source code obfuscator | Artifice | Download |
| Bytecode obfuscator | ProGuard | Download |
| Decompiler | Krakatau | Download |
| Decompiler | Procyon | Download |
Similarity Detection Tools
| Tool/technique | Similarity calculation | Link |
|---|---|---|
| Clone detectors | ||
| ccfx | tokens and suffix tree matching | Download |
| deckard | characteristic vectors of AST optimised by LSH | Download |
| iclones | tokens and generalised suffix tree | Download |
| nicad | TXL and string comparison (LCS) | Download |
| simian | line-based string comparison | Download |
| Plagiarism detectors | ||
| jplag-java | tokens, Karp Rabin matching, Greedy String Tiling | Download |
| jplag-text | tokens, Karp Rabin matching, Greedy String Tiling | Download |
| plaggie | N/A (not disclosed) | Download |
| sherlock | digital signatures | Download |
| simjava | tokens and string alignment | Download |
| simtext | tokens and string alignment | Download |
| Compression | ||
| 7zncd | NCD with 7z | |
| bzip2ncd | NCD with bzip2 | |
| gzipncd | NCD with gzip | |
| xzncd | NCD with xz | |
| icd |  |
|
| ncd | ncd tool with bzlib & zlib | Download |
| Others | ||
| bsdiff |  |
|
| diff |  |
|
| py-difflib | Gestalt pattern matching | Download |
| py-fuzzywuzzy | fuzzy string matching | Download |
| py-jellyfish | approximate and phonetic matching of strings py-ngram fuzzy search based using n-gram | Download |
| py-sklearn | cosine similarity from machine learning library | Download |
Scenario 1
Pervasive Modifications
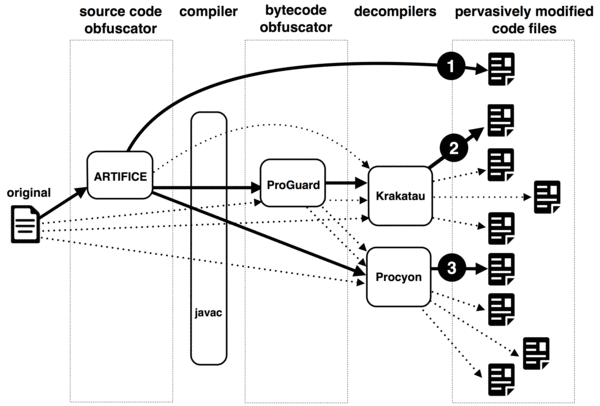
The data set in this scenario is created to simulate pervasive modifications made to source code by using source and bytecode obfuscators: Artifice, and ProGuard. The total number of pervasively modified source code files is 100. The process of code transformations is displayed below. The data set is called OCD (Obfuscation/Compilation/Decompilation).
Data set: Obfuscation/Compilation/Decompilation (OCD)
Scenario 2
Decompilation
In this scenario, the data set is based on the same set of 100 source code files generated in Scenario 1. However, we added normalisation through decompilation to the post-processing (step 3 in the framework) by compiling all the transformed files using javac and decompiling them using either Krakatau or Procyon.
Data set: OCDdecomp (krakatau)
Data set: OCDdecomp (procyon)
Scenario 3
Reused Boiler-Plate Code
In this scenario, we want to analyse the tools’ performance against a data set that contains files in which fragments of (boiler-plate) code are reused with or without modifications applied. We choose the training set of SOCO (SOurce COde re-use) data set that has been provided in a competition for discovering monolingual re-used source code amongst a given set of programs. The files in the SOCO data set are adapted from the study by Arwin et al. (2006). We found that many of them share the same or very similar boiler-plate code fragments which perform the same task. Some of the boiler-plate fragments have been modified to adapt them to the environment in which the fragment is re-used.
Data set: the SOCO data set can be obtained from the competition website (http://users.dsic.upv.es/grupos/nle/soco/).
Update: the original website is now not accessible. You can download a copy of the (pretty-printed) SOCO data set here.
Fixed answer key: the answer key for SOCO java training data set containing 97 pairs of reused code download
Scenario 4
Ranked Results
In our three previous scenarios (Ragkhitwetsagul et al., 2016), we compared the tools’ performances using their optimal F-scores. The F-score offers weighted harmonic mean of precision and recall. It is a set- based measure that does not consider any ordering of results. Instead of looking at the results as a set and applying a cut-off threshold to obtain true and false positives, we consider only a subset of the results based on their rankings. We adopt three error measures mainly used in information retrieval: precision-at-n (prec@n), average r- precision (ARP), and mean average precision (MAP) to measure the tools’ performances.
Further reading: Manning et al., Introduction to Information Retrieval, Cambridge University Press. 2008.
Scenario 5
Local + Glocal Modifications
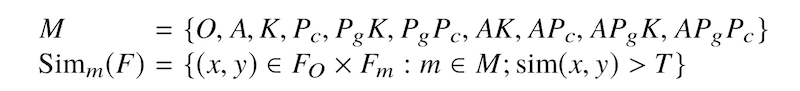
We have two objectives for this experimental scenario. First, we are interested in a situation where local and global code modifications are combined together. Second, we shift our focus from measuring how good our tools are on finding all similar pairs of pervasively modified code as we did in Scenario 1 to measure how good our tools are on finding similar pairs of code based on each pervasive code modification type. The table below presents the 10 pervasive code modification types; including the original (O), source code obfuscation by Artifice (A), decompilation by Krakatau (K), decompilation by Procyon (Pc), bytecode obfuscation by ProGuard and decompilation by Krakatau (PgK), bytecode obfuscation by ProGuard and decompilation by Procyon (PgPc), and four other combinations (AK, APc, APgK, APgPc); and ground truth for each of them. The number of code pairs and true positive pairs of A to APgPc are twice larger than the Original (O) type because of asymmetric similarity between pairs, i.e. Sim(x,y) and Sim(y,x).
| Type | Modification | Obfuscation | Decomp. | Pair | TP | |
| Source | Bytecode | |||||
| O | Original | 1,089 | 55 | |||
| A | Artifice | X | 2,178 | 110 | ||
| K | Krakatau | X | 2,178 | 110 | ||
| Pc | Procyon | X | 2,178 | 110 | ||
| PgK | ProGuard + Krakatau | X | X | 2,178 | 110 | |
| PgPC | ProGuard + Procyon | X | X | 2,178 | 110 | |
| AK | Artifice + Krakatau | X | X | 2,178 | 110 | |
| APc | Artifice + Procyon | X | X | 2,178 | 110 | |
| APgK | Artifice + ProGuard + Krakatau | X | X | X | 2,178 | 110 |
| APgPc | Artifice + ProGuard + Procyon | X | X | X | 2,178 | 110 |
We measured the tools’ performance on each Simm(F) set. By applying tools on a pair of original and pervasively modified code, we measure the tools based on one particular type of code modifications at a time.
Data set: SOCOgenerated
Results
RQ1
Performance Comparison
How well do current similarity detection techniques perform in the presence of pervasive source code modifications and boiler-plate code?
Pervasively modified code (OCD data set)
The table below shows the performance of all the tools and their optimal configurations. Using the F-score, ccfx is the winner with the highest value of 0.9760.
| Tool | Settings | Threshold | FP | FN | Acc | Prec | Rec | AUC | F-score | Ranking |
| Clone detectors | ||||||||||
| ccfx (C)* | b=5, t=11 | 36 | 24 | 24 | 0.9952 | 0.976 | 0.976 | 0.9995 | 0.976 | 1 |
| deckard (T)* | mintoken=30 | 17 | 44 | 227 | 0.9729 | 0.9461 | 0.773 | 0.9585 | 0.8509 | 6 |
| stride=2 | ||||||||||
| similarity=0.95 | ||||||||||
| iclones (L)* | minblock=10 | 0 | 36 | 358 | 0.9196 | 0.9048 | 0.4886 | 0.7088 | 0.6345 | 27 |
| minclone=50 | ||||||||||
| nicad (L)* | UPI=0.50 | 38 | 38 | 346 | 0.9616 | 0.9451 | 0.654 | 0.8164 | 0.773 | 23 |
| minline=8 | ||||||||||
| rename=blind | ||||||||||
| abstract=literal | ||||||||||
| simian (C)* | threshold=4 | 5 | 150 | 165 | 0.9685 | 0.8477 | 0.835 | 0.9262 | 0.8413 | 9 |
| ignoreVariableNames | ||||||||||
| Plagiarism detectors | ||||||||||
| jplag-java | t=7 | 19 | 58 | 196 | 0.9746 | 0.9327 | 0.804 | 0.9563 | 0.8636 | 3 |
| jplag-text | t=4 | 14 | 66 | 239 | 0.9695 | 0.9202 | 0.761 | 0.9658 | 0.8331 | 12 |
| plaggie | M=8 | 19 | 83 | 234 | 0.9683 | 0.9022 | 0.766 | 0.9546 | 0.8286 | 15 |
| sherlock | N=4, Z=2 | 6 | 142 | 196 | 0.9662 | 0.8499 | 0.804 | 0.9447 | 0.8263 | 17 |
| simjava | r=16 | 15 | 120 | 152 | 0.9728 | 0.876 | 0.848 | 0.9711 | 0.8618 | 5 |
| simtext | r=4 | 14 | 38 | 422 | 0.954 | 0.9383 | 0.578 | 0.8075 | 0.7153 | 25 |
| Compression tools | ||||||||||
| 7zncd-BZip2 | mx=1,3,5 | 45 | 64 | 244 | 0.9692 | 0.922 | 0.756 | 0.9557 | 0.8308 | 14 |
| 7zncd-Deflate | mx=7 | 38 | 122 | 215 | 0.9663 | 0.8655 | 0.785 | 0.9454 | 0.8233 | 20 |
| 7zncd-Deflate64 | mx=7,9 | 38 | 123 | 215 | 0.9662 | 0.8645 | 0.785 | 0.9453 | 0.8229 | 21 |
| 7zncd-LZMA | mx=7,9 | 41 | 115 | 213 | 0.9672 | 0.8725 | 0.787 | 0.9483 | 0.8275 | 16 |
| 7zncd-LZMA2 | mx=7,9 | 41 | 118 | 213 | 0.9669 | 0.8696 | 0.787 | 0.9482 | 0.8262 | 18 |
| 7zncd-PPMd | mx=9 | 42 | 140 | 198 | 0.9662 | 0.8514 | 0.802 | 0.9467 | 0.826 | 19 |
| bzip2ncd | C=1..9 | 38 | 62 | 216 | 0.9722 | 0.9267 | 0.784 | 0.9635 | 0.8494 | 7 |
| gzipncd | C=7 | 31 | 110 | 203 | 0.9687 | 0.8787 | 0.797 | 0.9556 | 0.8359 | 11 |
| icd | ma=LZMA2 | 50 | 86 | 356 | 0.9558 | 0.8822 | 0.644 | 0.9265 | 0.7445 | 24 |
| mx=7,9 | ||||||||||
| ncd-zlib | N/A | 30 | 104 | 207 | 0.9689 | 0.8841 | 0.793 | 0.9584 | 0.8361 | 10 |
| ncd-bzlib | N/A | 37 | 82 | 206 | 0.9712 | 0.9064 | 0.794 | 0.9636 | 0.8465 | 8 |
| xzncd | -e | 39 | 120 | 203 | 0.9677 | 0.8691 | 0.797 | 0.9516 | 0.8315 | 13 |
| Other similarity analysers | ||||||||||
| bsdiff* | N/A | 71 | 199 | 577 | 0.9224 | 0.6801 | 0.423 | 0.8562 | 0.5216 | 30 |
| % diff (L)* | N/A | 1 | 8810 | 8 | 0.1182 | 0.1012 | 0.992 | 0.4675 | 0.1837 | |
| % diff (T)* | N/A | 2 | 6528 | 134 | 0.3338 | 0.1171 | 0.866 | 0.4353 | 0.2063 | |
| diff (C)* | N/A | 8 | 626 | 184 | 0.919 | 0.5659 | 0.816 | 0.9364 | 0.6683 | 26 |
| py-difflib | whitespace=false | 28 | 12 | 232 | 0.9756 | 0.9846 | 0.768 | 0.9412 | 0.8629 | 4 |
| autojunk=false | ||||||||||
| py-fuzzywuzzy | token_set_ratio | 85 | 58 | 176 | 0.9766 | 0.9342 | 0.824 | 0.9772 | 0.8757 | 2 |
| py-jellyfish | jaro_distance | 78 | 340 | 478 | 0.9182 | 0.6056 | 0.522 | 0.8619 | 0.5607 | 29 |
| py-ngram | N/A | 49 | 110 | 224 | 0.9666 | 0.8758 | 0.776 | 0.941 | 0.8229 | 22 |
| py-sklearn | N/A | 48 | 292 | 458 | 0.925 | 0.6499 | 0.542 | 0.9113 | 0.5911 | 28 |
- Tools that do not report similarity value directly. Similarity is measured at the granularity level of line (L), token (T), or character (C).
Boiler-plate code (SOCO data set)
The table below shows the performance of all the tools and their optimal configurations. Using the F-score, jplag-text is the winner with the highest value of 0.9692.
| Tool | Settings | Threshold | FP | FN | Acc | Prec | Rec | AUC | F-score | Ranking |
| Clone detectors | ||||||||||
| Clone det. | ||||||||||
| ccfx (C)* | b=15,16,17 t=12 | 25 | 42 | 15 | 0.9992 | 0.9125 | 0.9669 | 0.9905 | 0.9389 | 7 |
| deckard (T)* | mintoken=50 | 19 | 27 | 17 | 0.9993 | 0.9417 | 0.9625 | 0.9823 | 0.9520 | 5 |
| stride=2 | ||||||||||
| similarity=1.00 | ||||||||||
| iclones (L)* | minblock=40 | 19 | 20 | 57 | 0.9989 | 0.9519 | 0.8742 | 0.9469 | 0.9114 | 12 |
| minclone=50 | ||||||||||
| nicad (L)* | UPI=0.30 | 22 | 19 | 51 | 0.9990 | 0.9549 | 0.8874 | 0.9694 | 0.9199 | 9 |
| minline=5 | ||||||||||
| rename=consistent | ||||||||||
| abstract=condition | ||||||||||
| simian (L)* | threshold=4 | 26 | 20 | 17 | 0.9994 | 0.9561 | 0.9625 | 0.9921 | 0.9593 | 3 |
| ignoreVariableNames | ||||||||||
| midrule | ||||||||||
| Plag. det. | ||||||||||
| jplag-java | t=12 | 29 | 26 | 13 | 0.9994 | 0.9442 | 0.9713 | 0.9895 | 0.9576 | 4 |
| jplag-text | t=9 | 32 | 16 | 12 | 0.9996 | 0.9650 | 0.9735 | 0.9939 | 0.9692 | 1 |
| plaggie | M=14 | 33 | 36 | 37 | 0.9989 | 0.9204 | 0.9183 | 0.9753 | 0.9193 | 10 |
| sherlock | N=5, Z=0 | 22 | 22 | 54 | 0.9989 | 0.9477 | 0.8808 | 0.9996 | 0.9130 | 11 |
| simjava | r=25 | 46 | 18 | 11 | 0.9996 | 0.9607 | 0.9757 | 0.9987 | 0.9682 | 2 |
| simtext | r=12 | 17 | 73 | 19 | 0.9986 | 0.8560 | 0.9581 | 0.9887 | 0.9042 | 13 |
| midrule | ||||||||||
| Compression | ||||||||||
| 7zncd-BZip2 | mx=1,3,5 | 64 | 24 | 118 | 0.9979 | 0.9331 | 0.7395 | 0.9901 | 0.8251 | 26 |
| 7zncd-Deflate | mx=7 | 64 | 27 | 97 | 0.9982 | 0.9295 | 0.7859 | 0.9937 | 0.8517 | 24 |
| 7zncd-Deflate64 | mx=7 | 64 | 27 | 96 | 0.9982 | 0.9297 | 0.7881 | 0.9957 | 0.8530 | 23 |
| 7zncd-LZMA | mx=7,9 | 69 | 11 | 99 | 0.9984 | 0.9699 | 0.7815 | 0.9940 | 0.8655 | 20 |
| 7zncd-LZMA2 | mx=7,9 | 69 | 11 | 99 | 0.9984 | 0.9699 | 0.7815 | 0.9939 | 0.8655 | 20 |
| 7zncd-PPMd | mx=9 | 68 | 19 | 106 | 0.9981 | 0.9481 | 0.7660 | 0.9948 | 0.8474 | 25 |
| bzip2ncd | C=1,2,3,..,8,9 | 54 | 20 | 94 | 0.9983 | 0.9473 | 0.7925 | 0.9944 | 0.8630 | 22 |
| gzipncd | C=9 | 54 | 25 | 82 | 0.9984 | 0.9369 | 0.8190 | 0.9961 | 0.8740 | 16 |
| icd | ma=LZMA mx=1,3 | 84 | 12 | 151 | 0.9976 | 0.9618 | 0.6667 | 0.9736 | 0.7875 | 27 |
| ncd-zlib | N/A | 57 | 10 | 91 | 0.9985 | 0.9731 | 0.7991 | 0.9983 | 0.8776 | 14 |
| ncd-bzlib | N/A | 52 | 30 | 82 | 0.9983 | 0.9252 | 0.8190 | 0.9943 | 0.8689 | 18 |
| xzncd | 2,3 | 64 | 13 | 94 | 0.9984 | 0.9651 | 0.7925 | 0.9942 | 0.8703 | 17 |
| 6,7,8,9,e | 65 | |||||||||
| midrule | ||||||||||
| Others | ||||||||||
| bsdiff | N/A | 90 | 2125 | 212 | 0.9652 | 0.1019 | 0.5320 | 0.9161 | 0.1710 | 29 |
| diff (C) | N/A | 29 | 7745 | 5 | 0.8845 | 0.0547 | 0.9890 | 0.9180 | 0.1036 | 30 |
| difflib | autojunk=true | 42 | 30 | 21 | 0.9992 | 0.9351 | 0.9536 | 0.9999 | 0.9443 | 6 |
| whitespace=true | ||||||||||
| fuzzywuzzy | ratio | 65 | 30 | 30 | 0.9991 | 0.9338 | 0.9338 | 0.9989 | 0.9338 | 8 |
| jellyfish | jaro_distance | 82 | 0 | 162 | 0.9976 | 1.0000 | 0.6424 | 0.9555 | 0.7823 | 28 |
| ngram | N/A | 59 | 20 | 84 | 0.9984 | 0.9486 | 0.8146 | 0.9967 | 0.8765 | 15 |
| cosine | N/A | 68 | 50 | 68 | 0.9982 | 0.8851 | 0.8499 | 0.9973 | 0.8671 | 19 |
- Tools that do not report similarity value directly. Similarity is measured at the granularity level of line (L), token (T), or character (C).
Area Under the ROC Curve (AUC)
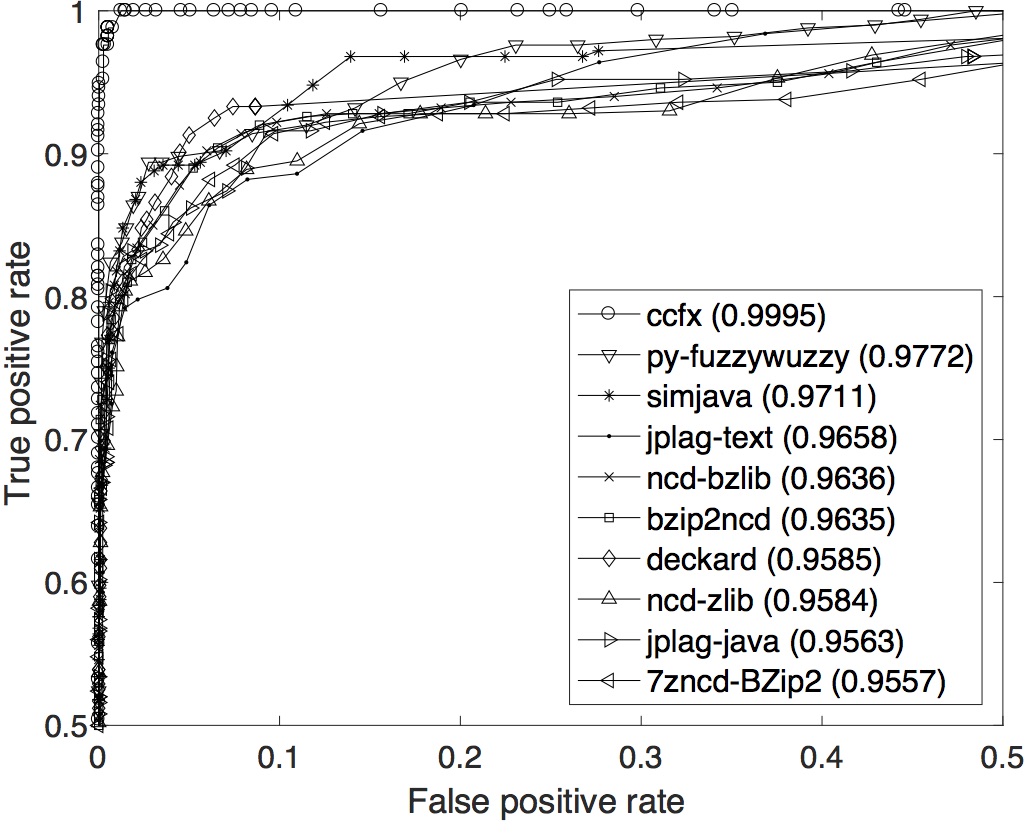
OCD data set: The ROC curves with their respective AUCs are displayed below. In term of the overall performance across the whole range of T, ccfx is the best with the highest AUC of 0.9995.
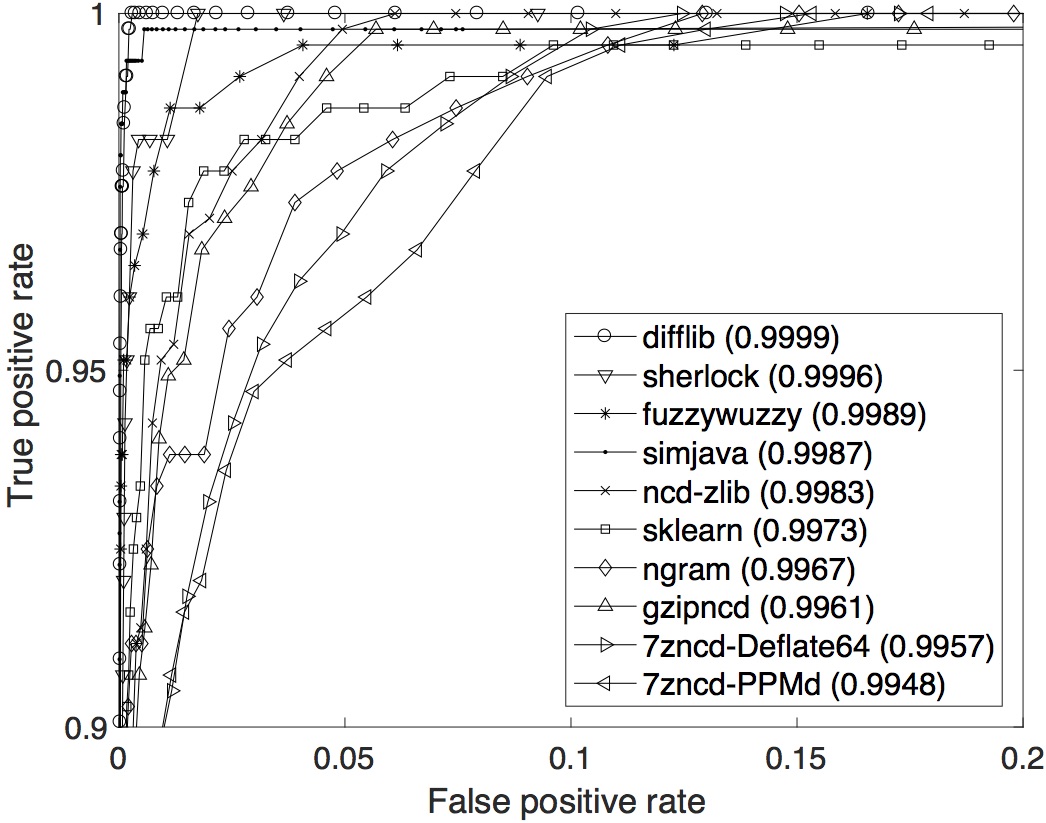
SOCO data set: The ROC curves with their respective AUCs are displayed below. In term of the overall performance across the whole range of T, difflib is the best with the highest AUC of 0.9999.
RQ2
Optimal Configurations
What are the best parameter settings and similarity thresholds for the techniques?
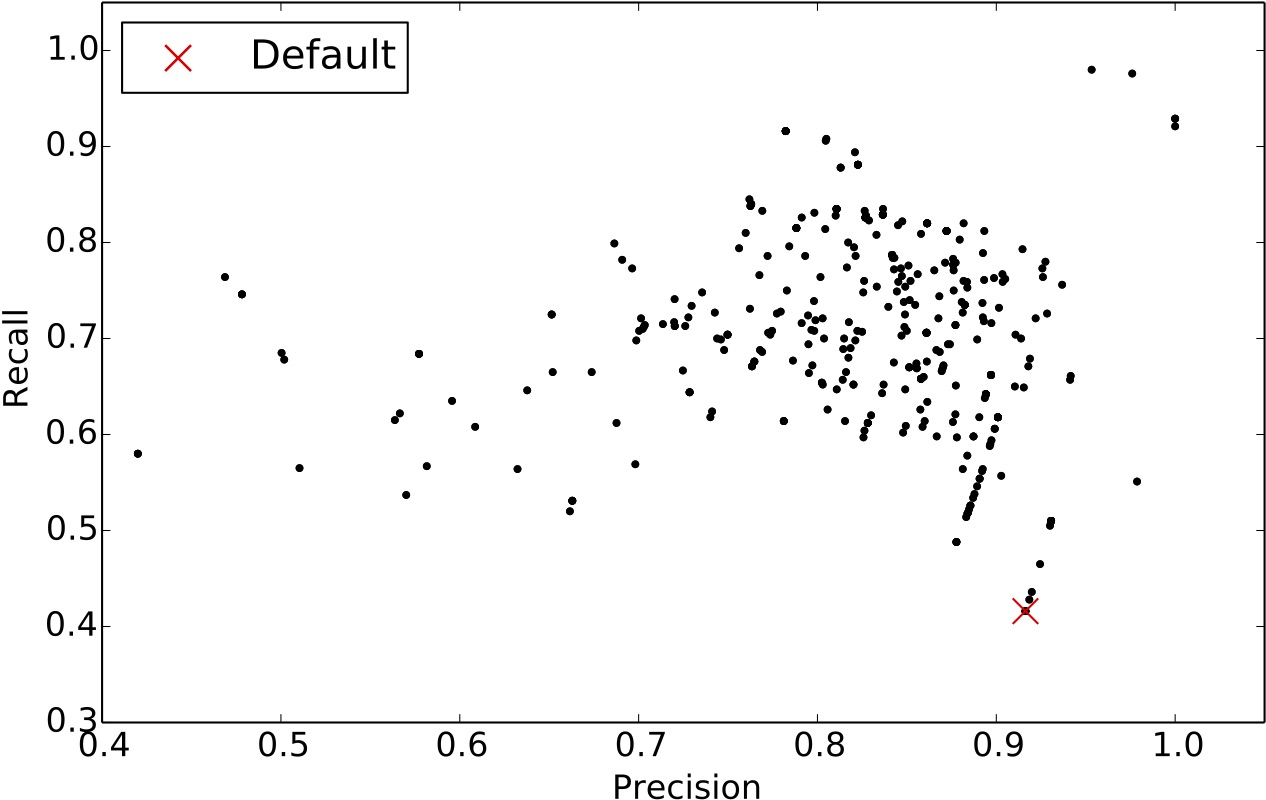
The optimal configurations of the tools can be found from the table above (2nd and 3rd column). Specifically, we inspected ccfx’s configurations and found the tool has its best configuration around b=19, t={7,9} and b=5, t={11,12} as depicted in the figure below.
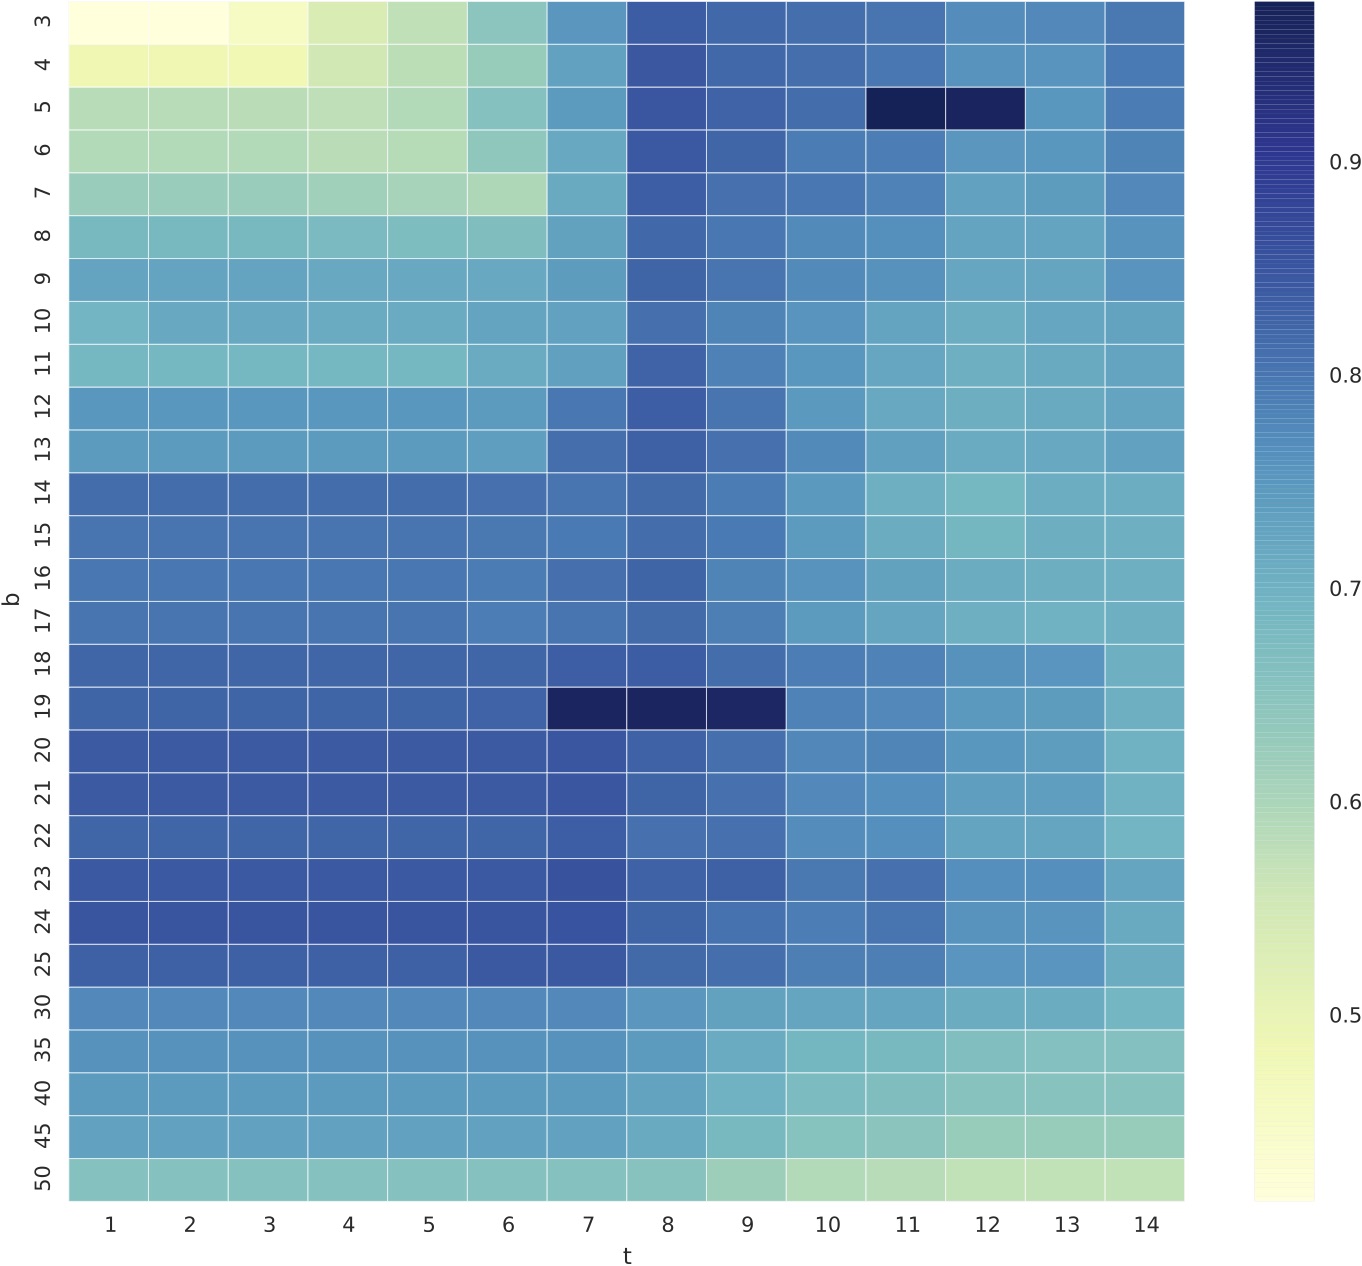
From the scatter plot below, we can see that the default settings of ccfx, b=50, t=12 (denoted with a red X symbol), provides a decent precision but very low recall. We observed that one cannot tune ccfx to obtain the highest precision without sacrificing recall.
RQ3
Normalisation by Decompilation
How much does compilation followed by decompilation as a pre-processing normalisation method improve detection results of pervasively modified code?
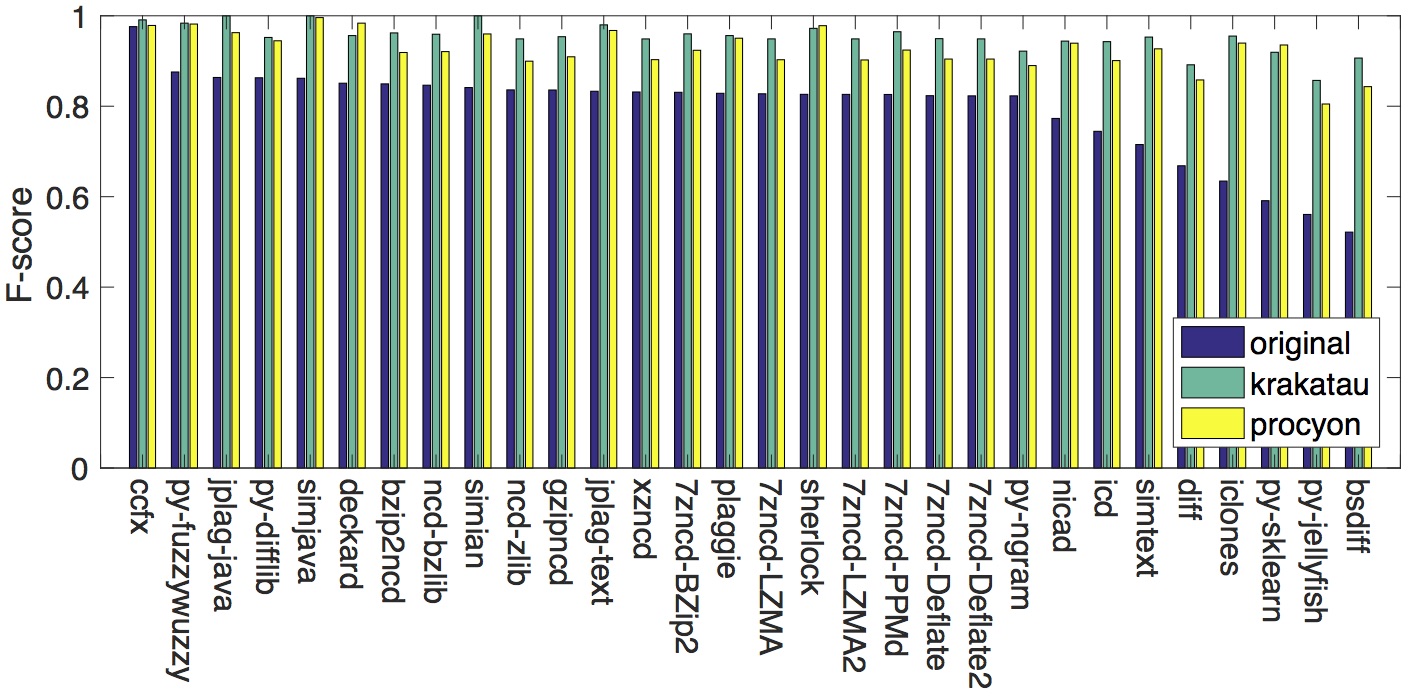
The results after adding compilation and decompilation for normalisation to the post-processing step before performing similarity detection is shown in the figure below. We can clearly observe that decompilation by both Krakatau and Procyon boosts the F-scores of every tool in the study.
The complete results can be found from the two tables below:
Decompiled by Krakatau
| Tool | Settings | Threshold | FP | FN | Acc | Prec | Rec | AUC | F-score | Ranking |
| Clone detectors | ||||||||||
| ccfx (C)* | b=5, t=11 | 36 | 24 | 24 | 0.9952 | 0.976 | 0.976 | 0.9995 | 0.976 | 1 |
| deckard (T)* | mintoken=30 | 17 | 44 | 227 | 0.9729 | 0.9461 | 0.773 | 0.9585 | 0.8509 | 6 |
| stride=2 | ||||||||||
| similarity=0.95 | ||||||||||
| iclones (L)* | minblock=10 | 0 | 36 | 358 | 0.9196 | 0.9048 | 0.4886 | 0.7088 | 0.6345 | 27 |
| minclone=50 | ||||||||||
| nicad (L)* | UPI=0.50 | 38 | 38 | 346 | 0.9616 | 0.9451 | 0.654 | 0.8164 | 0.773 | 23 |
| minline=8 | ||||||||||
| rename=blind | ||||||||||
| abstract=literal | ||||||||||
| simian (C)* | threshold=4 | 5 | 150 | 165 | 0.9685 | 0.8477 | 0.835 | 0.9262 | 0.8413 | 9 |
| ignoreVariableNames | ||||||||||
| Plagiarism detectors | ||||||||||
| jplag-java | t=7 | 19 | 58 | 196 | 0.9746 | 0.9327 | 0.804 | 0.9563 | 0.8636 | 3 |
| jplag-text | t=4 | 14 | 66 | 239 | 0.9695 | 0.9202 | 0.761 | 0.9658 | 0.8331 | 12 |
| plaggie | M=8 | 19 | 83 | 234 | 0.9683 | 0.9022 | 0.766 | 0.9546 | 0.8286 | 15 |
| sherlock | N=4, Z=2 | 6 | 142 | 196 | 0.9662 | 0.8499 | 0.804 | 0.9447 | 0.8263 | 17 |
| simjava | r=16 | 15 | 120 | 152 | 0.9728 | 0.876 | 0.848 | 0.9711 | 0.8618 | 5 |
| simtext | r=4 | 14 | 38 | 422 | 0.954 | 0.9383 | 0.578 | 0.8075 | 0.7153 | 25 |
| Compression tools | ||||||||||
| 7zncd-BZip2 | mx=1,3,5 | 45 | 64 | 244 | 0.9692 | 0.922 | 0.756 | 0.9557 | 0.8308 | 14 |
| 7zncd-Deflate | mx=7 | 38 | 122 | 215 | 0.9663 | 0.8655 | 0.785 | 0.9454 | 0.8233 | 20 |
| 7zncd-Deflate64 | mx=7,9 | 38 | 123 | 215 | 0.9662 | 0.8645 | 0.785 | 0.9453 | 0.8229 | 21 |
| 7zncd-LZMA | mx=7,9 | 41 | 115 | 213 | 0.9672 | 0.8725 | 0.787 | 0.9483 | 0.8275 | 16 |
| 7zncd-LZMA2 | mx=7,9 | 41 | 118 | 213 | 0.9669 | 0.8696 | 0.787 | 0.9482 | 0.8262 | 18 |
| 7zncd-PPMd | mx=9 | 42 | 140 | 198 | 0.9662 | 0.8514 | 0.802 | 0.9467 | 0.826 | 19 |
| bzip2ncd | C=1..9 | 38 | 62 | 216 | 0.9722 | 0.9267 | 0.784 | 0.9635 | 0.8494 | 7 |
| gzipncd | C=7 | 31 | 110 | 203 | 0.9687 | 0.8787 | 0.797 | 0.9556 | 0.8359 | 11 |
| icd | ma=LZMA2 | 50 | 86 | 356 | 0.9558 | 0.8822 | 0.644 | 0.9265 | 0.7445 | 24 |
| mx=7,9 | ||||||||||
| ncd-zlib | N/A | 30 | 104 | 207 | 0.9689 | 0.8841 | 0.793 | 0.9584 | 0.8361 | 10 |
| ncd-bzlib | N/A | 37 | 82 | 206 | 0.9712 | 0.9064 | 0.794 | 0.9636 | 0.8465 | 8 |
| xzncd | -e | 39 | 120 | 203 | 0.9677 | 0.8691 | 0.797 | 0.9516 | 0.8315 | 13 |
| Other similarity analysers | ||||||||||
| bsdiff* | N/A | 71 | 199 | 577 | 0.9224 | 0.6801 | 0.423 | 0.8562 | 0.5216 | 30 |
| % diff (L)* | N/A | 1 | 8810 | 8 | 0.1182 | 0.1012 | 0.992 | 0.4675 | 0.1837 | |
| % diff (T)* | N/A | 2 | 6528 | 134 | 0.3338 | 0.1171 | 0.866 | 0.4353 | 0.2063 | |
| diff (C)* | N/A | 8 | 626 | 184 | 0.919 | 0.5659 | 0.816 | 0.9364 | 0.6683 | 26 |
| py-difflib | whitespace=false | 28 | 12 | 232 | 0.9756 | 0.9846 | 0.768 | 0.9412 | 0.8629 | 4 |
| autojunk=false | ||||||||||
| py-fuzzywuzzy | token_set_ratio | 85 | 58 | 176 | 0.9766 | 0.9342 | 0.824 | 0.9772 | 0.8757 | 2 |
| py-jellyfish | jaro_distance | 78 | 340 | 478 | 0.9182 | 0.6056 | 0.522 | 0.8619 | 0.5607 | 29 |
| py-ngram | N/A | 49 | 110 | 224 | 0.9666 | 0.8758 | 0.776 | 0.941 | 0.8229 | 22 |
| py-sklearn | N/A | 48 | 292 | 458 | 0.925 | 0.6499 | 0.542 | 0.9113 | 0.5911 | 28 |
The complete list of the optimal configurations
the complete list of optimal configurations for Krakatau is shown below.
| Tool | Settings | Granularity | Threshold |
| ccfx | b=5, t=8 | T | 50 |
| b=5, t=11 | T | 17 | |
| deckard | mintoken=30, stride=1, similarity=0.95 | L, T, C | 29,29,34 |
| mintoken=30, stride=1, similarity=1.00 | L, T, C | 10,12,15 | |
| mintoken=30, stride=2, similarity=0.90 | T | 54 | |
| mintoken=30, stride=2, similarity=0.95 | L, T, C | 22,28,32 | |
| mintoken=30, stride=inf, similarity=0.95 | L, T, C | 29,29,34 | |
| mintoken=30, stride=inf, similarity=1.00 | L, T, C | 10,12,15 | |
| mintoken=50, stride=1, similarity=0.95 | L, T, C | 23,29,31 | |
| mintoken=50, stride=2, similarity=0.95 | L, T, C | 21,18,23 | |
| mintoken=50, stride=inf, similarity=0.95 | L, T, C | 23,28,31 | |
| simian | threshold={3,4}, ignoreidentifiers | T | 17 |
| threshold=3, ignoreidentifiers | C | ||
| threshold=5, ignoreidentifiers | L | 12 | |
| threshold=5, ignoreidentifiers | T | 13 | |
| simjava | r=18,19 | 17 | |
| r=20 | 16 | ||
| r=26,27 | 11 | ||
| r=28 | 9 | ||
| r=default | 27 | ||
| simtext | r=4 | 33 | |
| r=5 | 31 | ||
| icd | ma=LZMA, mx={7,9} | 54 | |
| ma=LZMA2, mx={7,9} |
Decompiled by Procyon
| Tool | Settings | Threshold | FP | FN | Acc | Prec | Rec | AUC | F-score | Ranking |
| Clone detectors | ||||||||||
| ccfx* (L) | b=20 t=1..7 | 11 | 4 | 38 | 0.9958 | 0.9959 | 0.962 | 0.997 | 0.9786 | 4 |
| deckard* (T) | mintoken=30 | 10 | 0 | 32 | 0.9968 | 1 | 0.968 | 0.9978 | 0.9837 | 2 |
| stride=1 inf | ||||||||||
| similarity=1.00 | ||||||||||
| iclones* (C) | minblock=10 | 0 | 18 | 98 | 0.9884 | 0.9804 | 0.902 | 0.9508 | 0.9396 | 11 |
| minclone=50 | ||||||||||
| nicad* (W) | UPI=0.30 | 11 | 16 | 100 | 0.9884 | 0.9825 | 0.9 | 0.9536 | 0.9394 | 12 |
| minline=10 | ||||||||||
| rename=blind | ||||||||||
| abstract=condition, literal | ||||||||||
| simian* (C) | threshold=3 | 23 | 8 | 70 | 0.9922 | 0.9915 | 0.93 | 0.9987 | 0.9598 | 8 |
| ignoreIdentifiers | ||||||||||
| Plagiarism detectors | ||||||||||
| jplag-java | t=8 | 22 | 0 | 72 | 0.9928 | 1 | 0.928 | 0.9887 | 0.9627 | 7 |
| jplag-text | t=9 | 11 | 16 | 48 | 0.9936 | 0.9835 | 0.952 | 0.9982 | 0.9675 | 6 |
| plaggie | M=13 14 | 10 | 16 | 80 | 0.9904 | 0.9829 | 0.92 | 0.9773 | 0.9504 | 9 |
| sherlock | N=1 Z=0 | 55 | 28 | 16 | 0.9956 | 0.9723 | 0.984 | 0.9997 | 0.9781 | 5 |
| simjava | r=default | 11 | 8 | 0 | 0.9992 | 0.9921 | 1 | 0.9999 | 0.996 | 1 |
| simtext | r=4 | 15 | 42 | 100 | 0.9858 | 0.9554 | 0.9 | 0.9686 | 0.9269 | 14 |
| r=default | 0 | |||||||||
| Compression tools | ||||||||||
| 7zncd-BZip2 | mx=1 3 5 | 51 | 30 | 116 | 0.9854 | 0.9672 | 0.884 | 0.9909 | 0.9237 | 16 |
| 7zncd-Deflate | mx=9 | 49 | 25 | 154 | 0.9821 | 0.9713 | 0.846 | 0.9827 | 0.9043 | 20 |
| 7zncd-Deflate64 | mx=9 | 49 | 25 | 154 | 0.9821 | 0.9713 | 0.846 | 0.9827 | 0.9043 | 20 |
| 7zncd-LZMA | mx=7 9 | 52 | 16 | 164 | 0.982 | 0.9812 | 0.836 | 0.9843 | 0.9028 | 23 |
| 7zncd-LZMA2 | mx=7 9 | 52 | 17 | 164 | 0.9819 | 0.9801 | 0.836 | 0.9841 | 0.9023 | 24 |
| 7zncd-PPMd | mx=9 | 53 | 22 | 122 | 0.9856 | 0.9756 | 0.878 | 0.9861 | 0.9242 | 15 |
| bzip2ncd | C=1..9 default | 47 | 12 | 140 | 0.9848 | 0.9862 | 0.86 | 0.9922 | 0.9188 | 18 |
| gzipncd | C=3 | 36 | 40 | 133 | 0.9827 | 0.9559 | 0.867 | 0.9846 | 0.9093 | 25 |
| icd | ma=LZMA, mx=7 9 | 54 | 37 | 150 | 0.9813 | 0.9583 | 0.85 | 0.9721 | 0.9009 | |
| ma=LZMA2, mx=7 9 | ||||||||||
| ncd-zlib | N/A | 41 | 30 | 158 | 0.9812 | 0.9656 | 0.842 | 0.9876 | 0.8996 | 26 |
| ncd-bzlib | N/A | 47 | 8 | 140 | 0.9852 | 0.9908 | 0.86 | 0.9923 | 0.9208 | 17 |
| xzncd | -e | 49 | 35 | 148 | 0.9817 | 0.9605 | 0.852 | 0.986 | 0.903 | 22 |
| Other similarity analysers | ||||||||||
| bsdiff | N/A | 73 | 48 | 236 | 0.9716 | 0.9409 | 0.764 | 0.9606 | 0.8433 | 29 |
| diff (C) | N/A | 23 | 6 | 244 | 0.975 | 0.9921 | 0.756 | 0.9826 | 0.8581 | 28 |
| py-difflib | autojunk=true | 26 | 12 | 94 | 0.9894 | 0.9869 | 0.906 | 0.9788 | 0.9447 | 10 |
| py-fuzzywuzzy | token_set_ratio | 90 | 0 | 36 | 0.9964 | 1 | 0.964 | 0.9992 | 0.9817 | 3 |
| py-jellyfish | jaro_winkler | 87 | 84 | 270 | 0.9646 | 0.8968 | 0.73 | 0.9218 | 0.8049 | 30 |
| py-ngram | N/A | 58 | 8 | 192 | 0.98 | 0.9902 | 0.808 | 0.9714 | 0.8899 | 27 |
| py-sklearn | N/A | 69 | 54 | 74 | 0.9872 | 0.9449 | 0.926 | 0.9897 | 0.9354 | 12 |
Statistical Tests
To strengthen the findings, we performed a statistical test to see if the performance before and after normalisation via decompilation differ with statistically significance. We chose non-parametric two-tailed Wilcoxon signed-rank test (however, we also tried using the randomisation (i.e. permutation) test on the results and found identical test results in all cases.) and performed the test with a confidence interval value of 95% (i.e. alpha <= 0.05). The table below shows that the observed F-scores before and after decompilation are different with statistical significance for both Krakatau and Procyon. We complement the statistical test by employing a non-parametric effect size measure called Vargha and Delaney’s A measure to measure the level of differences between two populations. Vargha and Delaney define 3 levels of a difference; small, medium, and large; by having A value over 0.56, 0.64, and 0.71, respectively. Using this scale, our F-score differences between before and after decompilation by Krakatau A=0.031) and Procyon (A=0.063) are small.
| Test | p-value | Significant? | Vargha-Delaney's A |
| Before-after decompiled by Krakatau | 1.863e-09 | Yes | 0.031 |
| Before-after decompiled by Procyon | 1.863e-09 | Yes | 0.063 |
To strengthen the findings, we performed a statistical test to see if the performance before and after normalisation via decompilation differ with statistically significance. We chose non-parametric two-tailed Wilcoxon signed-rank test (however, we also tried using the randomisation (i.e. permutation) test on the results and found identical test results in all cases.) and performed the test with a confidence interval value of 95% (i.e. alpha <= 0.05). The table below shows that the observed F-scores before and after decompilation are different with statistical significance for both Krakatau and Procyon. We complement the statistical test by employing a non-parametric effect size measure called Vargha and Delaney’s A measure to measure the level of differences between two populations. Vargha and Delaney define 3 levels of a difference; small, medium, and large; by having A value over 0.56, 0.64, and 0.71, respectively. Using this scale, our F-score differences between before and after decompilation by Krakatau A=0.031) and Procyon (A=0.063) are small.
RQ4
Reuse of Configurations
Can we reuse optimal configurations from one data set in another data set effectively?
For the 10 highest ranking tools from RQ1, we applied the derived optimal configurations obtained from the generated data set (denoted as Cgenerated* to the SOCO data set. The table below shows that using these configurations has a detrimental impact on the similarity detection results for another data set, even for tools that have no parameters (e.g. ncd-zlib and ncd-bzlib) and are only influenced by the chosen similarity threshold.
| Tools | OCD | SOCO | |||||
| Settings | T | OCD | SOCO | Settings | T | SOCO | |
| F-score | F-score | F-score | |||||
| ccfx (C) | b=5 t=11 | 36 | 0.976 | 0.8441 | b=15 16 17 | 25 | 0.9389 |
| t=12 | |||||||
| py-fuzzywuzzy | token_set_ratio | 85 | 0.8757 | 0.6012 | ratio | 65 | 0.9338 |
| jplag-java | t=7 | 19 | 0.8636 | 0.3168 | t=12 | 29 | 0.9576 |
| py-difflib | autojunk=false | 28 | 0.8629 | 0.2113 | autojunk=true | 42 | 0.9443 |
| whitespace=false | whitespace=true | ||||||
| simjava | r=16 | 15 | 0.8618 | 0.5888 | r=25 | 23 | 0.9259 |
| deckard (T) | mintoken=30 | 17 | 0.8509 | 0.3305 | mintoken=50 | 19 | 0.952 |
| stride=2 | stride=1 | ||||||
| similarity=0.95 | similarity=1.0 | ||||||
| bzip2ncd | C=1..9 | 38 | 0.8494 | 0.3661 | C=1 .. 9 | 54 | 0.863 |
| ncd-bzlib | N/A | 37 | 0.8465 | 0.3357 | N/A | 52 | 0.8689 |
| simian (C) | threshold=4 | 5 | 0.8413 | 0.6394 | threshold=4 | 26 | 0.9593 |
| ignoreVariableNames | ignoreVariableNames | ||||||
| ncd-zlib | N/A | 30 | 0.8361 | 0.3454 | N/A | 57 | 0.8776 |
RQ5
Ranked Results
Which tools perform best when only the top n results are retrieved?
We applied additional three error measures; precision-at-n (prec@n), average r-precision (ARP) and mean average precision (MAP); adopted from information retrieval to the OCD and SOCO data set. The results are shown below. The complete settings can be found in the CSV files below.
Ranked results: genereated data set
| Ranking | Pair-based | Query-based | ||
| F-score | prec@n | ARP | MAP | |
| 1 | (0.976) ccfx | (0.976) ccfx | (1.000) ccfx | (1.000) ccfx |
| 2 | (0.876) fuzzywuzzy | (0.860) simjava | (0.915) fuzzywuzzy | (0.949) fuzzywuzzy |
| 3 | (0.864) jplag-java | (0.858) fuzzywuzzy | (0.913) ncd-bzlib | (0.943) ncd-bzlib |
| 4 | (0.863) difflib | (0.842) simian | (0.912) 7zncd-BZip2 | (0.942) bzip2ncd |
| 5 | (0.862) simjava | (0.836) deckard | (0.909) bzip2ncd | (0.938) 7zncd-BZip2 |
| 6 | (0.851) deckard | (0.836) jplag-java | (0.900) 7zncd-PPMd | (0.937) gzipncd |
| 7 | (0.849) bzip2ncd | (0.832) bzip2ncd | (0.900) gzipncd | (0.935) ncd-zlib |
| 8 | (0.847) ncd-bzlib | (0.828) difflib | (0.898) ncd-zlib | (0.933) jplag-text |
| 9 | (0.841) simian | (0.826) ncd-bzlib | (0.898) xzncd | (0.930) 7zncd-PPMd |
| 10 | (0.836) ncd-zlib | (0.820) 7zncd-BZip2 | (0.895) 7zncd-LZMA2 | (0.929) xzncd |
Ranked results: SOCO data set
| Ranking | Pair-based | Query-based | ||
| F-score | prec@n | ARP | MAP | |
| 1 | (0.969) jplag-text | (0.965) jplag-text | (0.998) jplag-java | (0.997) jplag-java |
| 2 | (0.968) simjava | (0.960) simjava | (0.998) difflib | (0.997) difflib |
| 3 | (0.959) simian | (0.956) simian | (0.989) ccfx | (0.993) jplag-text |
| 4 | (0.958) jplag-java | (0.947) deckard | (0.989) simjava | (0.988) simjava |
| 5 | (0.952) deckard | (0.943) jplag-java | (0.987) gzipncd | (0.987) gzipncd |
| 6 | (0.944) difflib | (0.938) difflib | (0.986) jplag-text | (0.987) ncd-zlib |
| 7 | (0.939) ccfx | (0.929) ccfx | (0.985) ncd-zlib | (0.986) sherlock |
| 8 | (0.934) fuzzywuzzy | (0.929) fuzzywuzzy | (0.984) 7zncd-Deflate | (0.986) 7zncd-Deflate64 |
| 9 | (0.920) nicad | (0.914) plaggie | (0.984) 7zncd-Deflate64 | (0.986) 7zncd-Deflate |
| 10 | (0.919) plaggie | (0.901) nicad | (0.983) 7zncd-LZMA | (0.984) fuzzywuzzy |
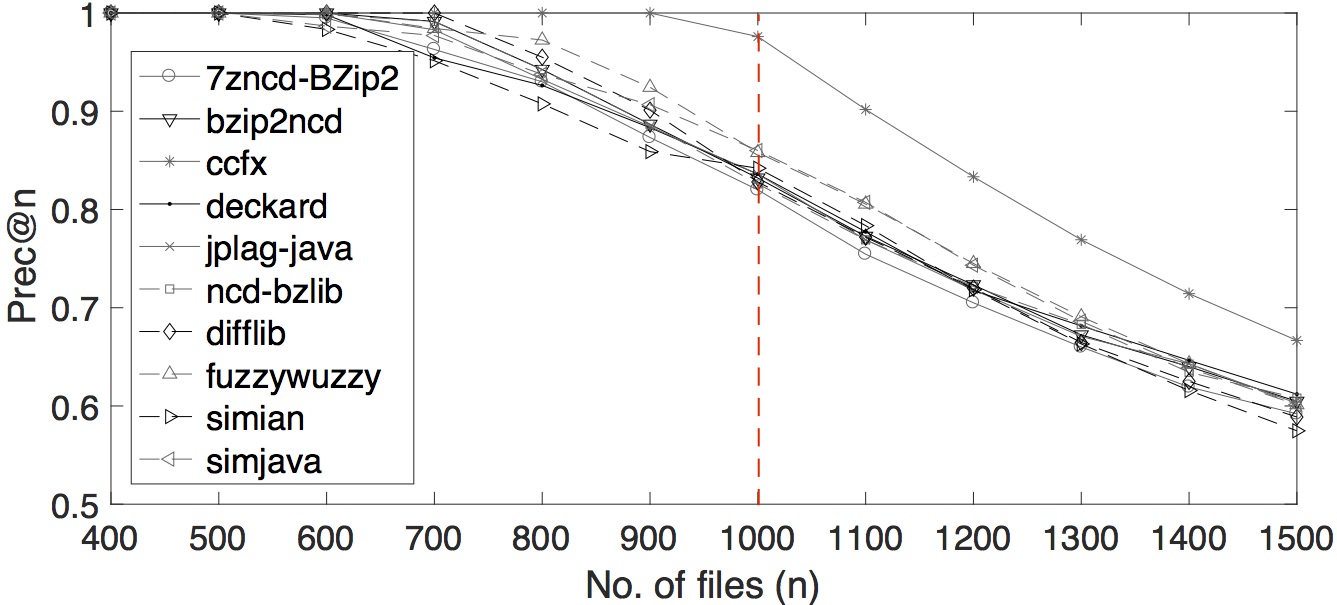
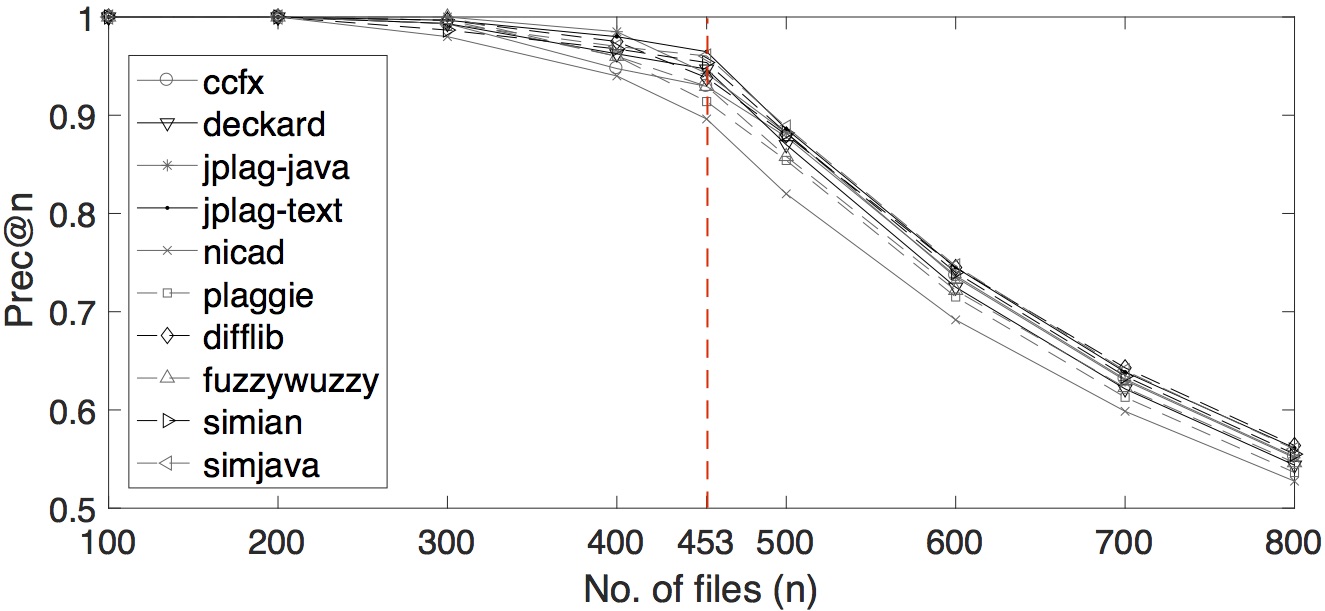
We also varied several number of n for precision-at-n. The plot of the tools’ performances by multiple precision-at-n values are shown below.
Multiple prec-at-n values for OCD data set
Multiple prec-at-n values for SOCO data set
Statistical Tests
Since ARP are computed based on mean, we performed a statistical test to strengthen our results by testing for statistical significance of differences in the set of r-precision values between tools. We chose a one-tailed non-parametric randomisation test (i.e. permutation test) due to its robustness test results in information retrieval as shown by Smucker et al. (2007) (we also tried using one-tailed Wilcoxon signed-rank test on the results and found identical test results in all cases). We performed the test using 100,000 random samples with a confidence interval value of 95% (i.e. alpha <= 0.05). The statistical test results show, for the generated data set, ccfx is the only tool that dominates other tools on their r-precisions values with statistical significance. For SOCO data set, jplag-java and difflib outperform 7zncd-Deflate, 7zncd-Deflate64, and 7zncd-LZMA with statistical significance.
Similarly, since MAP is also computed based on mean, we performed a one-tailed non-parametric randomisation statistical test on pairwise comparisons of the tools’ MAP values. The test results show, for the generated data set, ccfx dominating other tools’ MAPs with statistical significance. For the SOCO data set, we found that jplag-java and difflib outperform gzipncd, ncd-zlib, sherlock, 7zncd-Deflate64, 7zncd-Deflate, and fuzzywuzzy with statistical significance.
RQ6
Local + Global Modification
How well do the techniques perform when source code containing boiler-plate code clones have been pervasively modified?
We evaluate the tools on a data set combining both local and global code modifications. This question also studies which types of pervasive modifications (source code obfuscation, bytecode obfuscation, compilation/decompilation) provide strong effects to tools’ performances.
Tools’ Performances vs. Individual Pervasive Modification Type
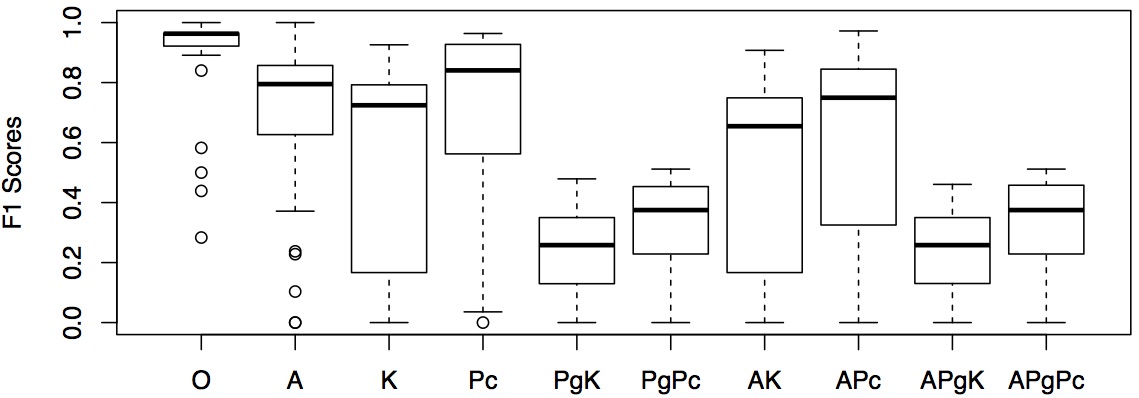
Using the results from Experimental Scenario 5, we present the tools performances based on F-scores in the table below and show the distribution of F-scores in a boxplot. The F-scores are grouped according to the 10 pervasive code modification types. The numbers are highlighted when F-scores are higher than 0.8.
| Tool | F-score | ||||||||||
| O | A | K | Pc | PgK | PgPc | AK | APc | APgK | A PgPc | ||
| Clone det. | |||||||||||
| ccfx (C)* | 0.8911 | 0.3714 | 0.0000 | 0.6265 | 0.0000 | 0.1034 | 0.0000 | 0.2985 | 0.0000 | 0.1034 | |
| deckard (T)* | 0.9636 | 0.9217 | 0.1667 | 0.3333 | 0.0357 | 0.2286 | 0.1667 | 0.3252 | 0.0357 | 0.2286 | |
| iclones (L)* | 0.5000 | 0.0000 | 0.0000 | 0.0357 | 0.0000 | 0.0000 | 0.0000 | 0.0000 | 0.0000 | 0.0000 | |
| nicad (T)* | 0.5823 | 0.0000 | 0.0000 | 0.0000 | 0.0000 | 0.0000 | 0.0000 | 0.0000 | 0.0000 | 0.0000 | |
| simian (L)* | 0.8350 | 0.1034 | 0.0357 | 0.1356 | 0.0000 | 0.0357 | 0.0000 | 0.0357 | 0.0000 | 0.0357 | |
| Plagiarism det. | |||||||||||
| jplag-java | 1.0000 | 1.0000 | 0.7429 | 0.9524 | 0.2973 | 0.4533 | 0.7547 | 0.9720 | 0.2973 | 0.4507 | |
| jplag-text | 0.9815 | 0.6265 | 0.5581 | 0.6304 | 0.3590 | 0.4250 | 0.4906 | 0.5581 | 0.3590 | 0.4304 | |
| plaggie | 0.9636 | 0.9159 | 0.7363 | 0.9372 | 0.2171 | 0.4626 | 0.7363 | 0.9423 | 0.2171 | 0.4626 | |
| sherlock | 0.9483 | 0.8298 | 0.7872 | 0.8298 | 0.3061 | 0.3516 | 0.6744 | 0.7826 | 0.3061 | 0.3516 | |
| simjava | 0.9649 | 0.9815 | 1.0000 | 0.7525 | 0.3188 | 0.3913 | 0.8041 | 0.7525 | 0.3188 | 0.3913 | |
| simtext | 0.9649 | 0.7191 | 0.1667 | 0.4932 | 0.0357 | 0.1667 | 0.0702 | 0.2258 | 0.0357 | 0.1667 | |
| Compression | |||||||||||
| 7zncd-BZip2 | 0.9273 | 0.7736 | 0.6852 | 0.8649 | 0.2446 | 0.3704 | 0.6423 | 0.7465 | 0.2446 | 0.3704 | |
| 7zncd-Deflate | 0.9483 | 0.7579 | 0.6935 | 0.8406 | 0.2427 | 0.3333 | 0.6360 | 0.7418 | 0.2427 | 0.3333 | |
| 7zncd-Deflate64 | 0.9483 | 0.7579 | 0.6935 | 0.8406 | 0.2427 | 0.3333 | 0.6360 | 0.7373 | 0.2427 | 0.3333 | |
| 7zncd-LZMA | 0.9649 | 0.7967 | 0.7488 | 0.8851 | 0.2663 | 0.3842 | 0.6768 | 0.7665 | 0.2632 | 0.3842 | |
| 7zncd-LZMA2 | 0.9649 | 0.7934 | 0.7536 | 0.8851 | 0.2718 | 0.3923 | 0.6700 | 0.7632 | 0.2697 | 0.4000 | |
| 7zncd-PPMd | 0.9623 | 0.7965 | 0.7628 | 0.8909 | 0.2581 | 0.3796 | 0.6667 | 0.8019 | 0.2581 | 0.3796 | |
| bzip2ncd | 0.9649 | 0.8305 | 0.8302 | 0.9273 | 0.3590 | 0.4681 | 0.7612 | 0.8448 | 0.3562 | 0.4681 | |
| gzipncd | 0.9623 | 0.7965 | 0.7628 | 0.8909 | 0.2581 | 0.3796 | 0.6667 | 0.8019 | 0.2581 | 0.3796 | |
| icd | 0.9216 | 0.5058 | 0.4371 | 0.5623 | 0.2237 | 0.2822 | 0.3478 | 0.4239 | 0.2237 | 0.2822 | |
| ncd-zlib | 0.9821 | 0.8571 | 0.8246 | 0.9432 | 0.4021 | 0.4920 | 0.7491 | 0.8559 | 0.3963 | 0.4920 | |
| ncd-bzlib | 0.9649 | 0.8269 | 0.8269 | 0.9273 | 0.3529 | 0.4634 | 0.7500 | 0.8448 | 0.3500 | 0.4719 | |
| xzncd | 0.9734 | 0.8416 | 0.7925 | 0.9198 | 0.3133 | 0.4615 | 0.7035 | 0.8148 | 0.3133 | 0.4615 | |
| Others | |||||||||||
| bsdiff | 0.4388 | 0.2280 | 0.1529 | 0.2005 | 0.1151 | 0.1350 | 0.1276 | 0.1596 | 0.1152 | 0.1353 | |
| diff (C) | 0.2835 | 0.2374 | 0.1585 | 0.2000 | 0.1296 | 0.1248 | 0.1530 | 0.1786 | 0.1302 | 0.1249 | |
| difflib | 0.9821 | 0.9550 | 0.8952 | 0.9565 | 0.4790 | 0.5087 | 0.8688 | 0.9381 | 0.4606 | 0.5091 | |
| fuzzywuzzy | 1.0000 | 0.9821 | 0.9259 | 0.9636 | 0.4651 | 0.5116 | 0.9074 | 0.9541 | 0.4557 | 0.5116 | |
| jellyfish | 0.9273 | 0.7253 | 0.6400 | 0.6667 | 0.2479 | 0.3579 | 0.5513 | 0.5000 | 0.2479 | 0.3662 | |
| ngram | 1.0000 | 0.9464 | 0.8952 | 0.9346 | 0.4110 | 0.4490 | 0.8785 | 0.8908 | 0.4054 | 0.4578 | |
| cosine | 0.9074 | 0.6847 | 0.7123 | 0.6800 | 0.3500 | 0.3596 | 0.5823 | 0.5287 | 0.3500 | 0.3596 | |